
A gauge of U.S. investment plans slipped more in August than initially estimated, giving a cautionary sign for the economic outlook.
New orders for non-military capital goods outside of aviation fell 0.8 percent in August, the Commerce Department said on Friday.
The government had previously reported that this gauge, which is a leading indicator of business investment, had fallen 0.2 percent during the month.
Shipments of this category of goods also fell, declining a sharper-than-initially reported 0.4 percent and giving a bearish signal for third-quarter economic growth.
New orders for overall U.S. factory goods fell 1.7 percent in August, Friday’s report showed. Analysts had expected new orders for factory goods to fall 1.2 percent.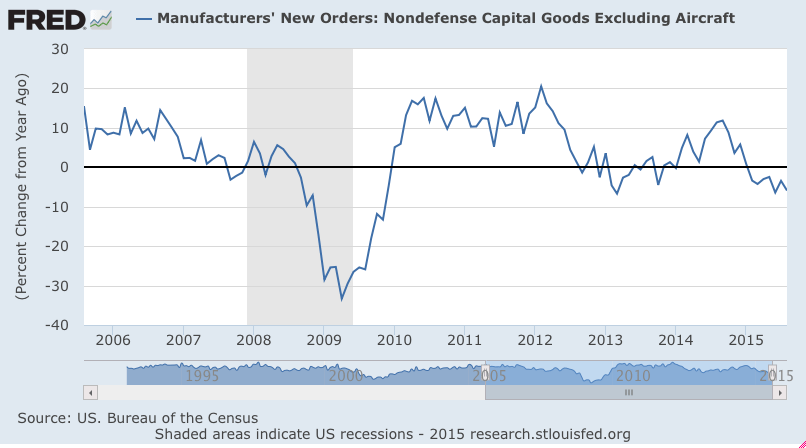
Yet another consumer spending chart that shows it’s been going down since the drop in oil prices that most insisted would cause a sharp increase: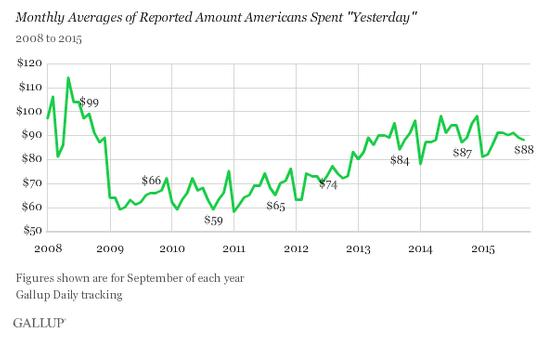
The ‘Markit’ surveys aren’t all that credible but do make news: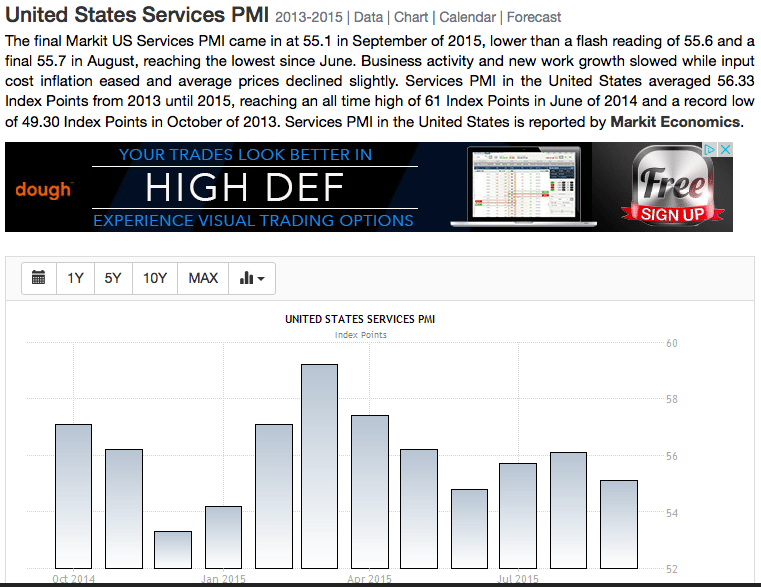
Also lower than expected and more credible, and indicates to me the service sector is now following the manufacturing sector that’s already gone negative. Interesting how the ‘Highlights’ narrative below sees it otherwise:
ISM Non-Mfg Index![]()
Highlights
Understandable slowing in new orders and business activity, which have been extraordinarily strong in the two prior reports, pulled down ISM’s non-manufacturing index to a still very solid 56.9 in September.
One component, however, that did not slow and which, had it been released last week, would have sent the wrong signal for the employment report is a 2.3 point jump in the employment index to 58.3. This, together with July’s 59.6, are some of the strongest readings in the 18-year history of this series and a puzzle given softness in the government’s payroll data.
Readings throughout this report are very strong including backlogs which have been building for four straight months and new export orders which have been rising for five months (note that foreign demand for U.S. services has proven very resilient at the same time that foreign demand for U.S. goods has been declining sharply.) The price indication in this report shows slight contraction in contrast to other surveys where price contraction is very sharp.
This report, together with the services PMI released earlier this morning, underscore the fundamental domestic-based strength of the U.S. economy.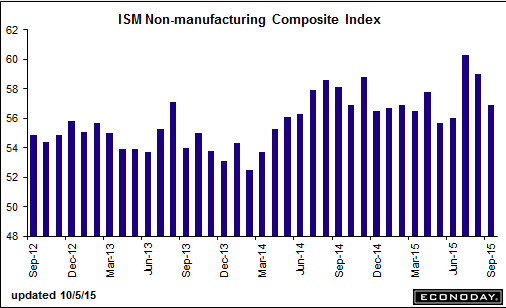
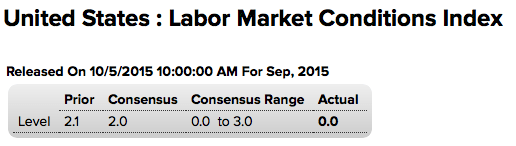
And now the Fed’s own labor market indicator is suggesting weakness as well:
The post Capex Revision, Gallup Spending Survey, PMI, ISM Non Mfg Index appeared first on The Center of the Universe.
