
Yields on JGB’s fall a bit with S&P downgrade. I’ve spoken to S&P. They know better. They are intellectually dishonest.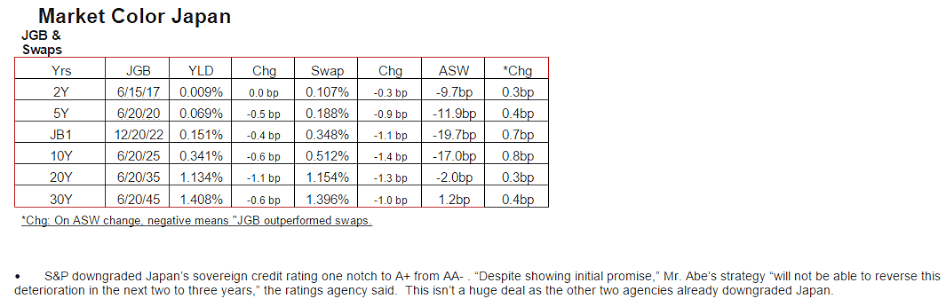
I included these as they give some indication of the macro outlook:
FedEx Trims Outlook on Weak Freight Demand Sept 16 (WSJ) — FedEx said it expects adjusted earnings of $10.40 to $10.90 a share for the year ending May 31, down from its previous guidance of $10.60 to $11.10 a share. Average daily volume for Ground’s package business grew 4% in the quarter, which was about in line with the company’s expectations. Ground’s operating income slipped 1% to $537 million, while revenue shot up 29% to $3.83 billion in part from the addition of GENCO. For the first quarter ended Aug. 31, FedEx posted a profit of $692 million, or $2.42 a share, up from $653 million, or $2.26 a share, a year earlier. Revenue increased 5% to $12.3 billion.
Sept 16 (WSJ) — Oracle said net income fell 20% in the period ended Aug. 31, but was off only 8% excluding currency effects. Total revenue, off 2%, was up 7% on a constant-currency basis, Oracle said. Oracle said new licenses declined 16% in dollars, or 9% in constant currency. Overall, Oracle reported a profit of $1.75 billion, or 40 cents a share, down from $2.18 billion, or 48 cents a share, a year earlier. Excluding stock-based compensation and other items, profit would have been 53 cents a share, compared with 62 cents a year earlier. Total revenue declined to $8.45 billion from $8.6 billion a year earlier.
Euro friendly:
Italy : Merchandise Trade![]()
Highlights
The seasonally adjusted trade balance was in a E3.7 billion surplus in July, up from an unrevised E2.6 billion excess in June.
However, the headline improvement masked contractions in both sides of the balance sheet. Hence, exports fell 0.4 percent on the month, their third decline since March but only due to weakness in energy (ex-energy exports grew 0.4 percent). Imports were off a steeper 3.7 percent (minus 4.0 percent ex-energy). Compared with a year ago, exports were up 6.3 percent after a 9.4 percent rise in June and imports 4.2 percent higher following a 12.2 percent gain last time.
The July black ink was more than 6 percent above its average level in the second quarter. This suggests that net exports could provide a boost to real GDP this quarter having been a drag in the previous period.
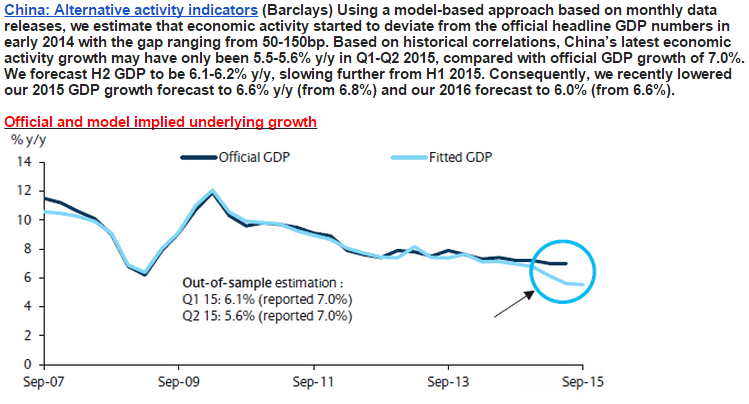
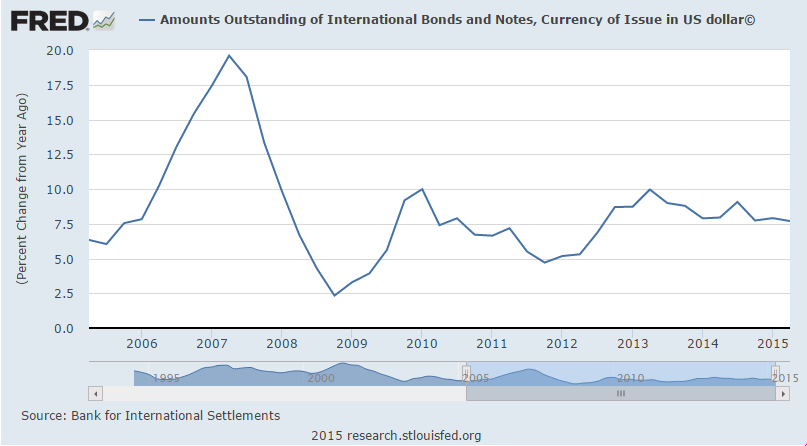
They talk about the ‘portfolio balance channel’ meaning investors shifting to ‘riskier assets’ due to QE, etc. But at the macro level, it’s about the total ‘risky assets’ available, and it looks like the growth rate is declining:
No sign of a burst in issuance here: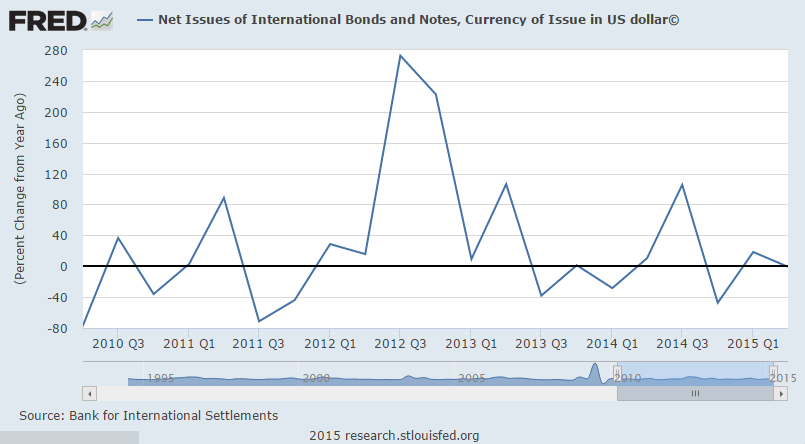
Housing Starts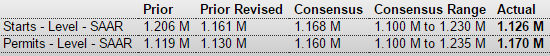
Highlights
Housing starts fell back in August but not permits which gained and point to strength for starts ahead. Starts fell 3.0 percent in the month to a lower-than-expected 1.126 million annual pace while permits rose 3.5 percent to a higher-than-expected 1.170 million. Starts for single-family homes, like the headline for starts, also fell 3.0 percent in August but follow a 10.9 percent surge in July. Permits for single-family homes rose 2.8 percent in the latest month to 699,000 which is the highest since 2008.
Housing under construction is also at a 2008 high, at 920,000 vs 908,000 in July. But completions were down in the month, from July’s 966,000 pace to a still healthy 935,000.
By region, starts data show increasing strength for the South which is by far the largest region, up 7.1 percent in the month. Permits in the South rose 2.4 percent for a 10 percent year-on-year gain. Permits in the West are the strongest of any region, up 9.6 percent in the month for a year-on-year rate surge of 36 percent.
Revisions to July were mixed with starts revised lower but permits higher. On net, this report is another positive for housing which is proving to be a key sector for the 2015 economy.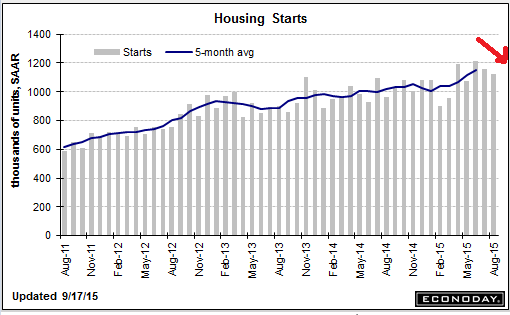
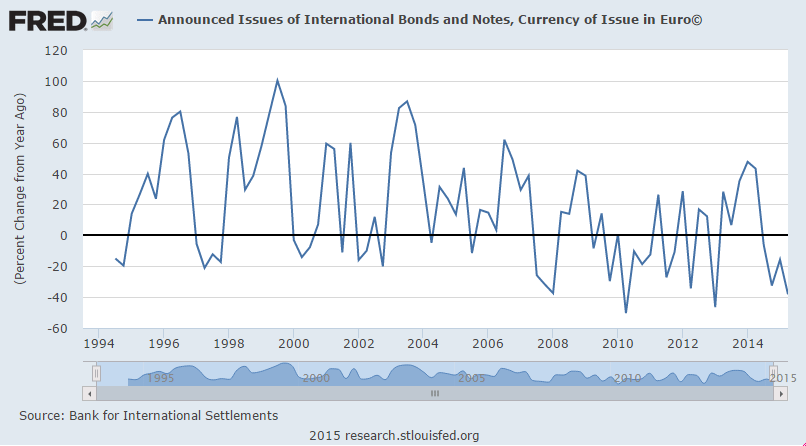
Steady progress but still depressed and still well below the lows of the 2001 recession: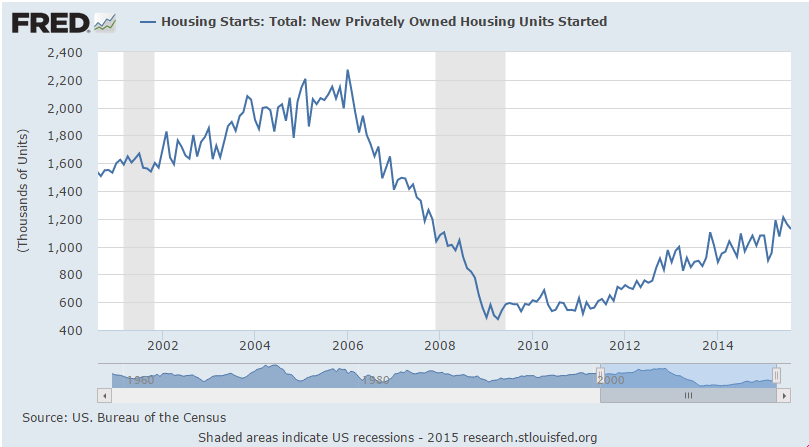
Too soon to tell if the prior spike will be followed by a more serious collapse: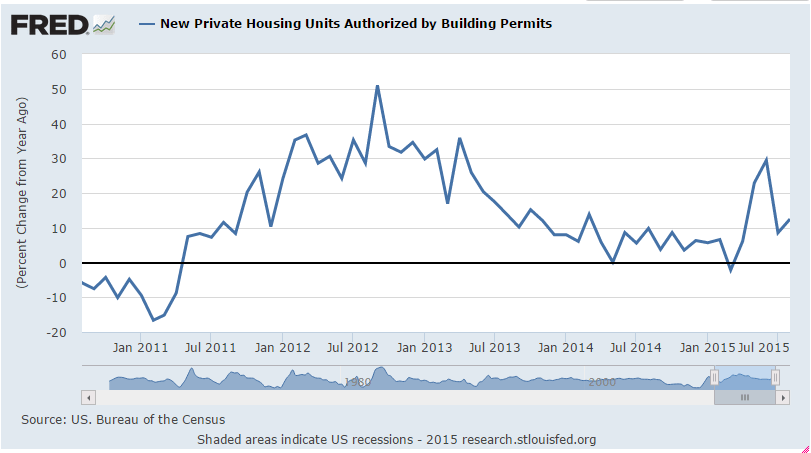
Philadelphia Fed Business Outlook Survey![]()
Highlights
There may very well be something wrong with the manufacturing sector, at least in the Northeast where the Empire State index has been in deep negative ground for the last two months followed now by a minus 6.0 headline for the Philly Fed index. This is the first negative reading since February 2014.
But the headlines for both of these reports, which are not composite scores of separate components, are sentiment scores of sorts, rough month-to-month assessments of general conditions. A key positive in today’s is continued strength in new orders which rose 3.6 points to 9.4. Unfilled orders, nevertheless, have been trending into contraction, at minus 6.6 for the third straight negative reading.
But some details are very strong with shipments at plus 14.8 and employment at plus 10.2 for a 5-month high. In a negative signal also seen in the Empire State report, prices received, that is prices for final goods, is in contraction at minus 5.0.
The Fed is wondering whether global volatility and stock market losses are affecting consumer confidence. Early data this month from regional Feds suggest the effects may also be extending to business sentiment.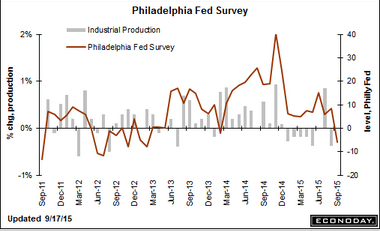
Sept 17 (Econintersect) — Week 36 of 2015 shows same week total rail traffic (from same week one year ago) collapsed according to the Association of American Railroads (AAR) traffic data. Intermodal traffic significantly declined year-over-year, which accounts for approximately half of movements. and weekly railcar counts continued in contraction. It could be that the data last week was screwed up – and the data this week was an adjustment.
And so how good can the US economy be if the Fed thinks the appropriate fed funds rate is still near 0%?
;)
The post Japan Downgrade, China GDP Model, Earnings Reports, Italian Trade, Housing Starts, Rail Traffic, Fed Comment appeared first on The Center of the Universe.
